- Access Key Management: Claim a secret access key to interact with the Sequence stack
- Cloudflare Worker: Create a function that queries the Sequence stack and produces project specific data points
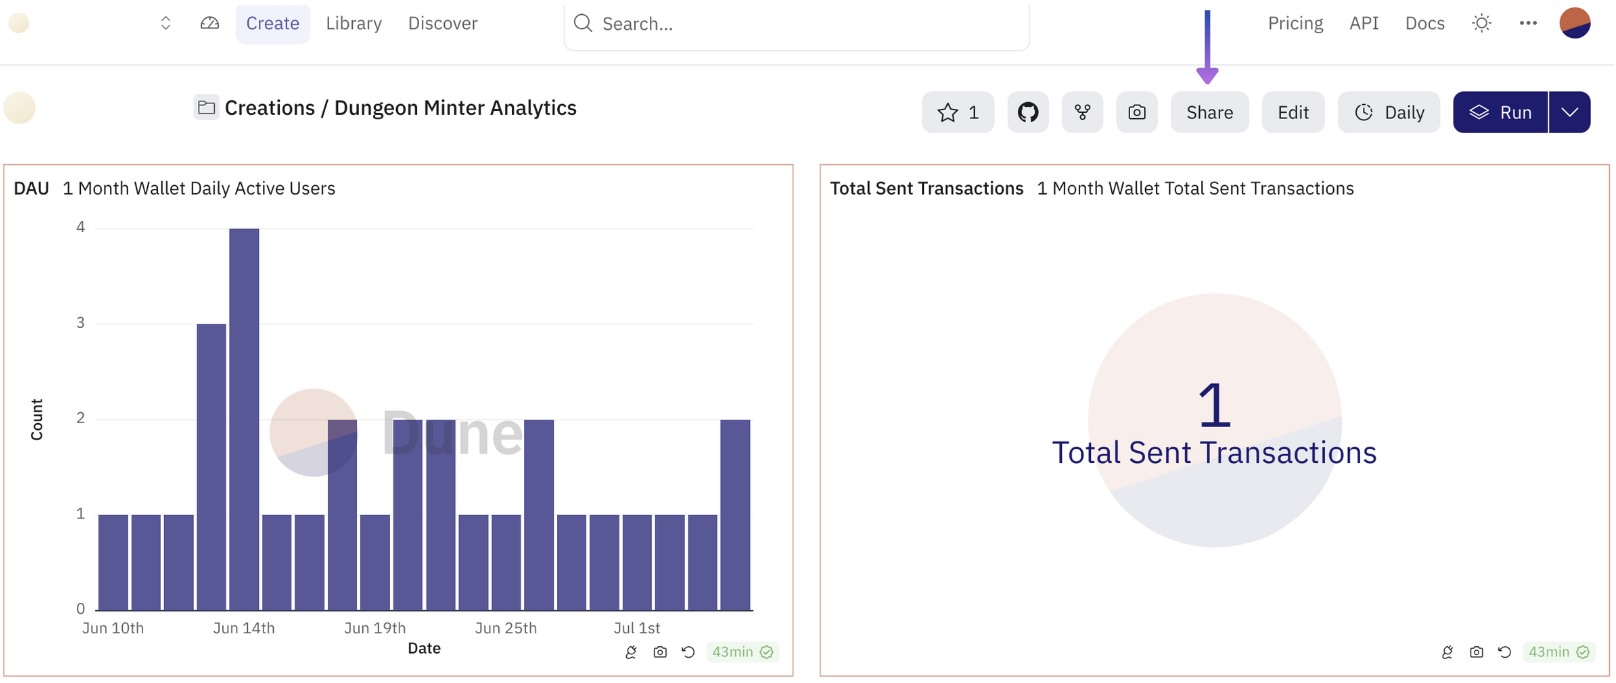
- Dune Dashboard: Create a view into the data as a shareable dashboard
A reference to the template code can be found
here
1. Access Key Management
You’ll need to acquire a Secret Access Key for your project in order to authenticate your application with the Sequence stack. Use the following steps:Secret Access Key Creation
1
Access Settings
First start by accessing settings, and selecting the API Keys card: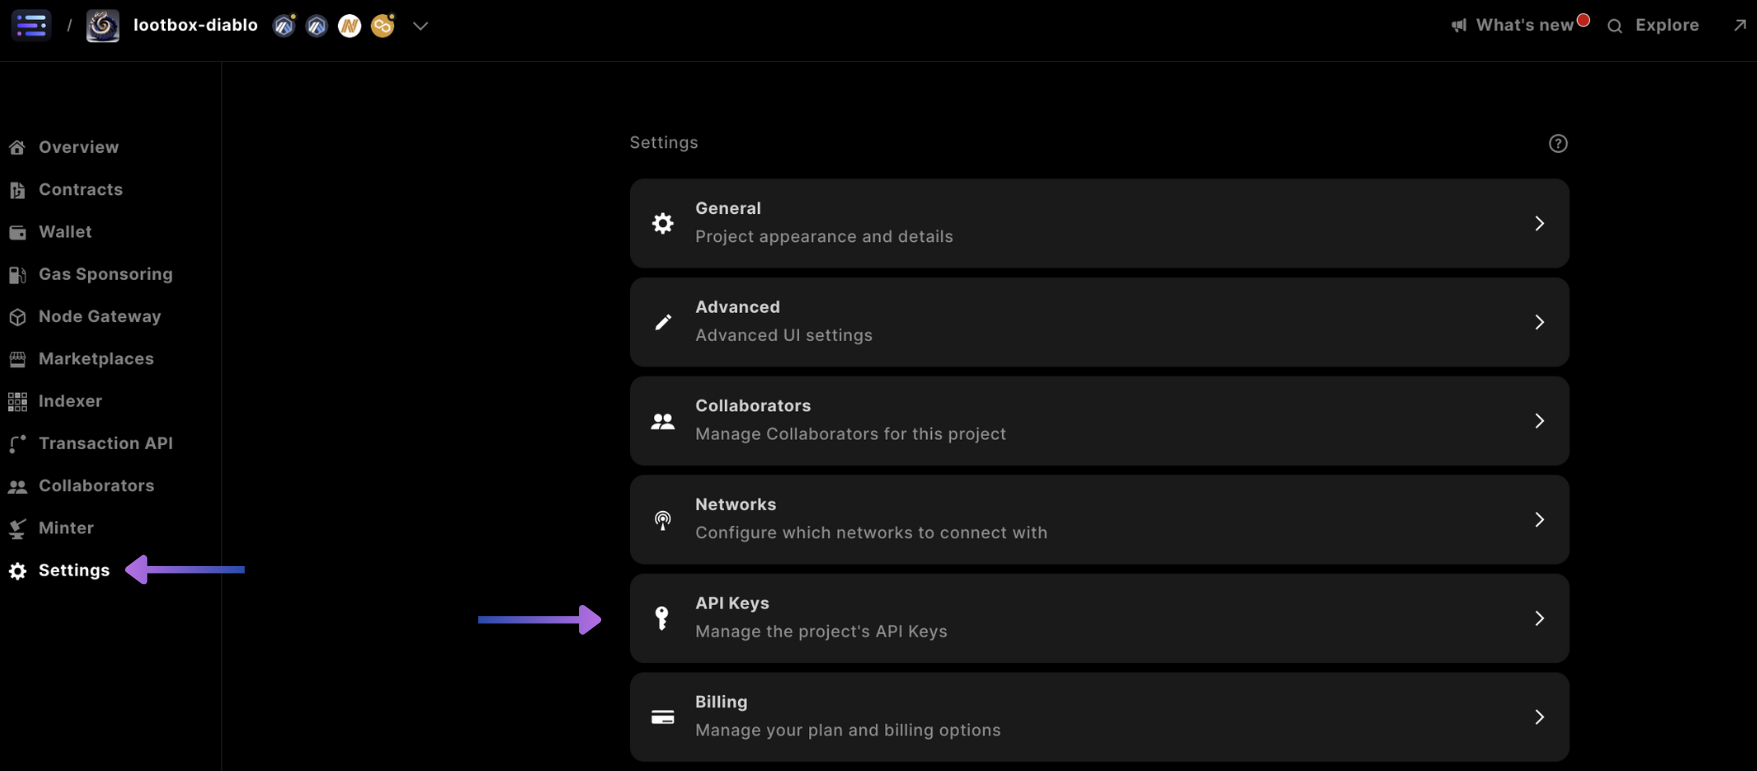
2
Add Service Account
Scroll down and select 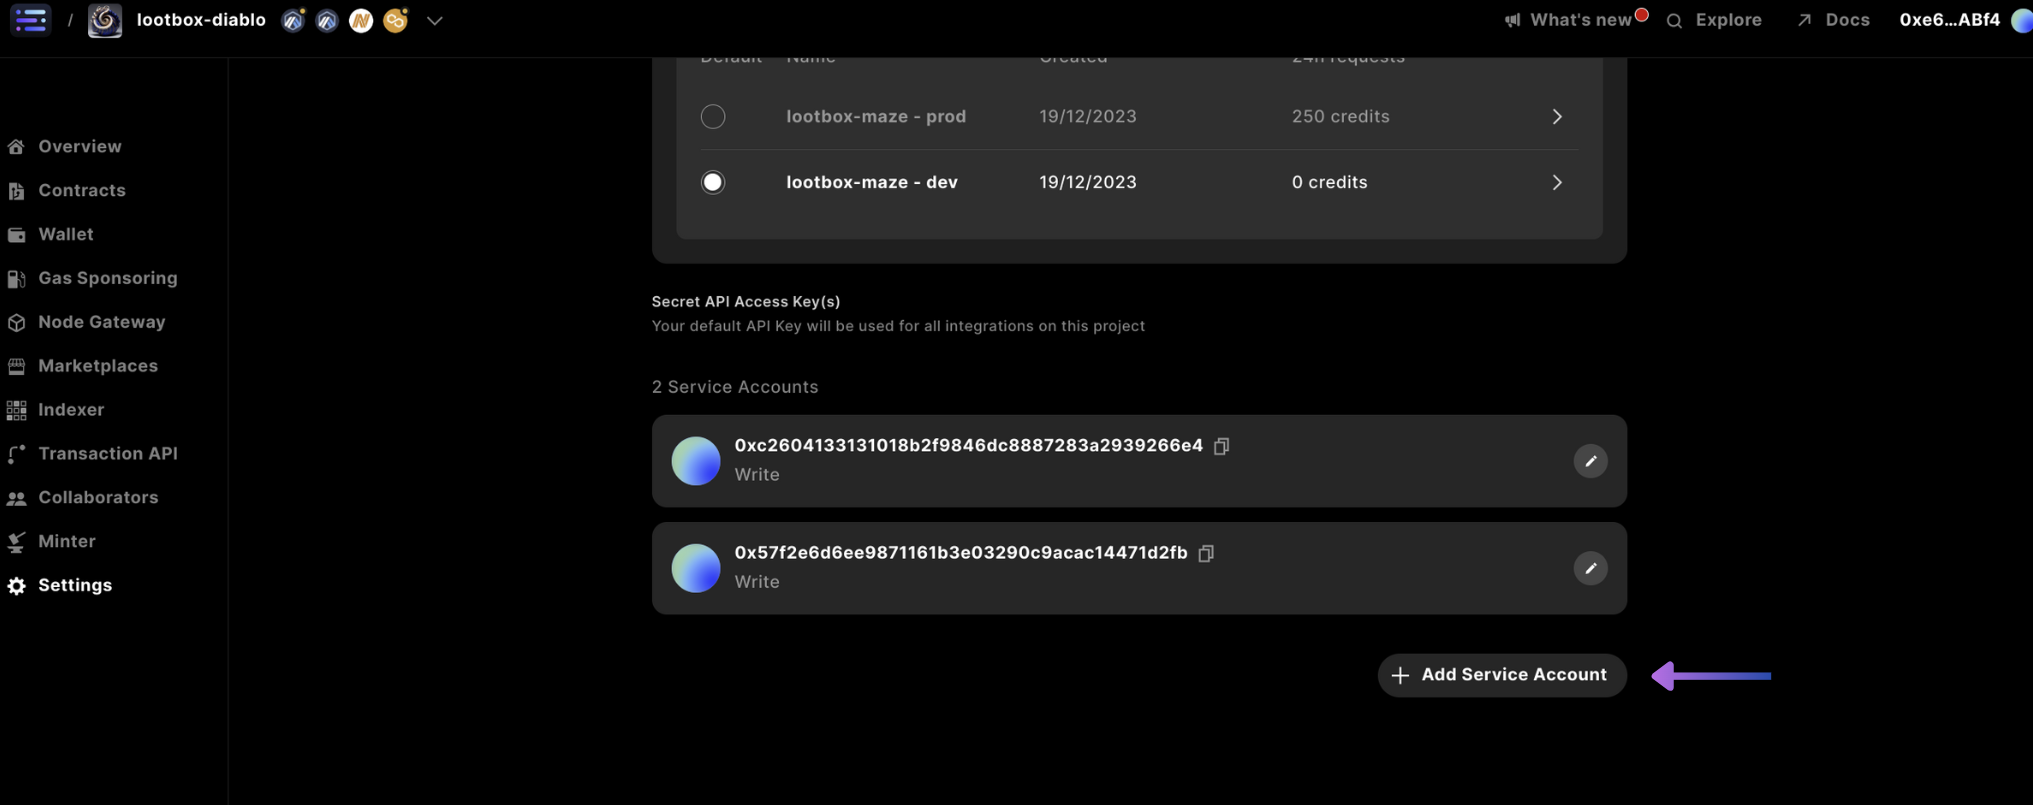
+ Add Service Account:3
Select Write Permission
Then change the permission to 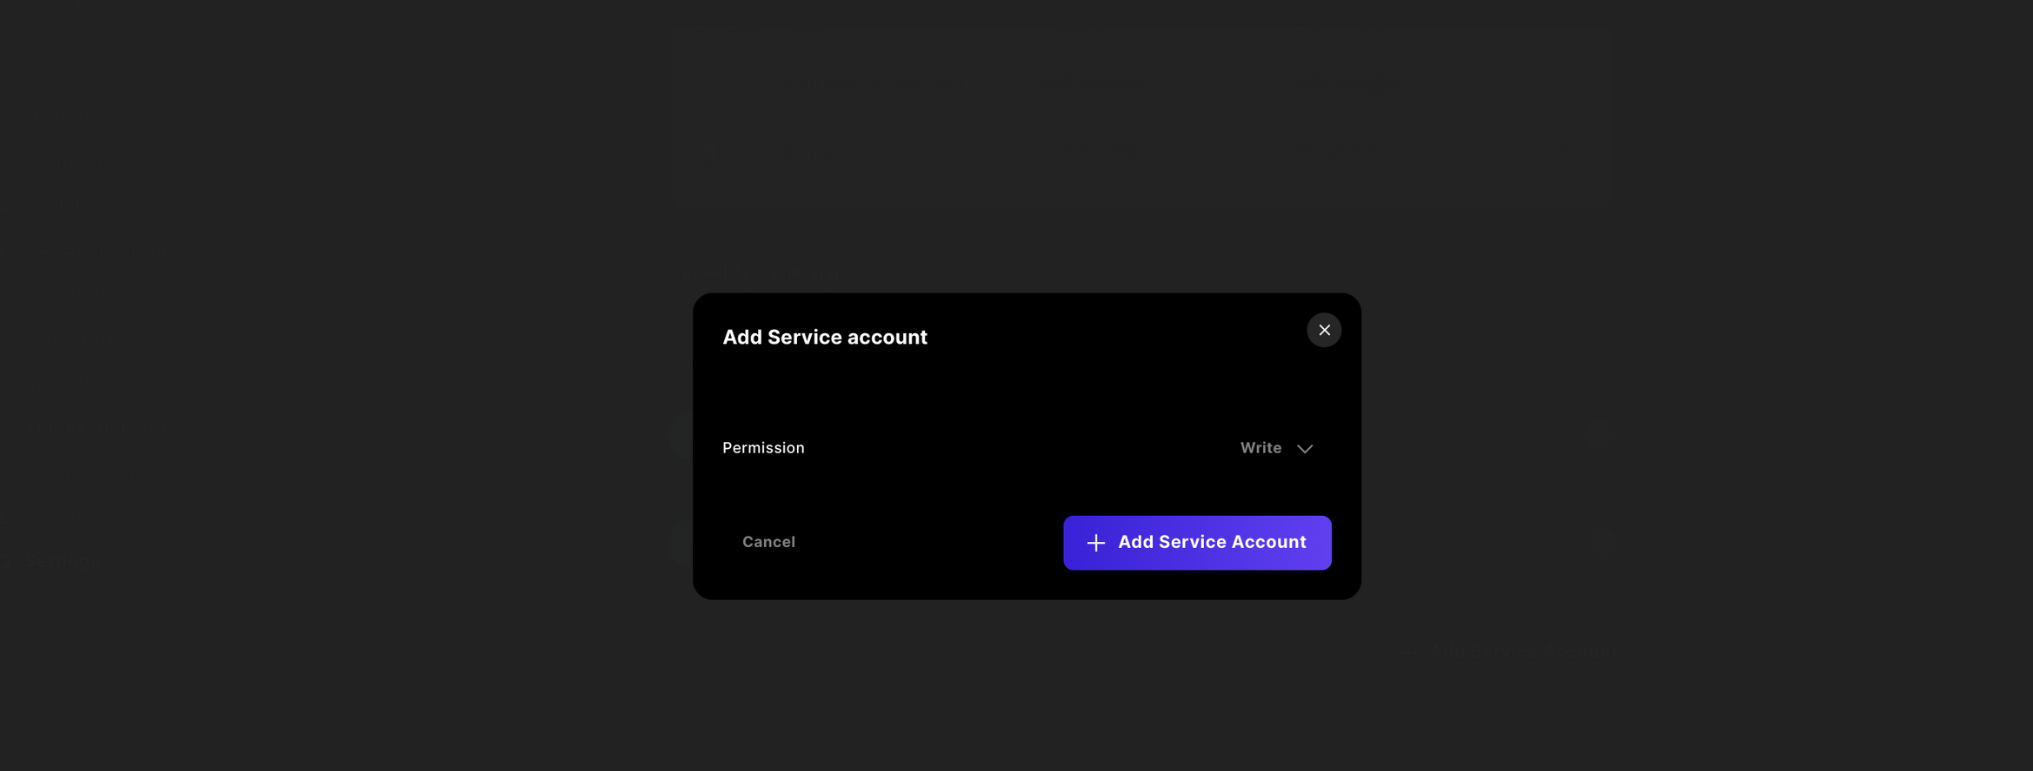
Write, click on + Add Service Account, and select Confirm:copy the key and store it in a safe location, as you will not have access to this in the future from the Sequence Builder.2. Cloudflare Worker
In this example, we utilize a Cloudflare Worker to experience automatic scaling based on dashboard use, and easy deployments from the cli, but of course you can use your own backend or other serverless alternatives.1
Create Project
In order to create the project from scratch, first create a project with
mkdir, cd into the project, and run pnpm init to create a package.json.2
'Hello World' Worker
Make sure wrangler cli is installed in your project and set the Create an account on the Cloudflare site and perform a login step to login to your Cloudflare dashboard to connect the Cloudflare platform to your local development environment.Once logged in, initialize the project in the directory with the command To complete this step, you should press enter 4 times after
wrangler keyword as an alias in your local bash session.wrangler init and accept one of the randomly generated project folder names provided that you like, and follow the prompts to initialize your git tracked typescript "Hello World" Worker application.wrangler init with the last 2 step answered as No to decline git versioning and deployment.This will clone down a starter repository that can be used to deploy code to the cloud.Local API Testing
At any point in the guide, you can use the
At any point in the guide, you can use the
wrangler dev command in the project folder for
local testingDeploy Test
Finally,cd into the randomly generated project folder, and perform a wrangler deploy command.This should print a URL, which you can enter in the browser the URL https://<app>.<account>.workers.dev to view the Hello World! result.3
Setup Config, Routes, & Mock functions
Once you have the project setup, update your Then include the Replace the existing Using the following functions:
wrangler.toml with the following variables, where DAYS is the time period you’re looking at:Env type with the variables in index.ts:fetch function with the following mocked function calls:4
Date Formatting
Next, include the following utility functions to parse the correct date from the updated value in the
wrangler.toml for the DAYS variable:5
Daily Active Users
Now, handle the
Daily Active Users request by using the following function, that calls the Sequence Analytics API:6
Total Transactions Sent
Finally, add the following function for the
Total Transactions Sent:7
Included Spacing for Days of Zero Data
Included in the Sequence Analytics API is the days with zero activity removed from the response. However, if you want to include days with zero data in your Dune queries to showcase the spacing of time in relation of data, you can use the following function to complete the days not showing data in the correct date format:Then for both call responses include the following method call with the
walletStats data passed in:/dailyActiveUsers & /totalTransactionsSent) once you have redeployed with wrangler deploy.
For more examples of endpoints available through the Analytics API, please check out the
overview page.
3. Dune Dashboard
1
Dune Sign Up
First, sign up to Dune
2
Create Query
Access your account at 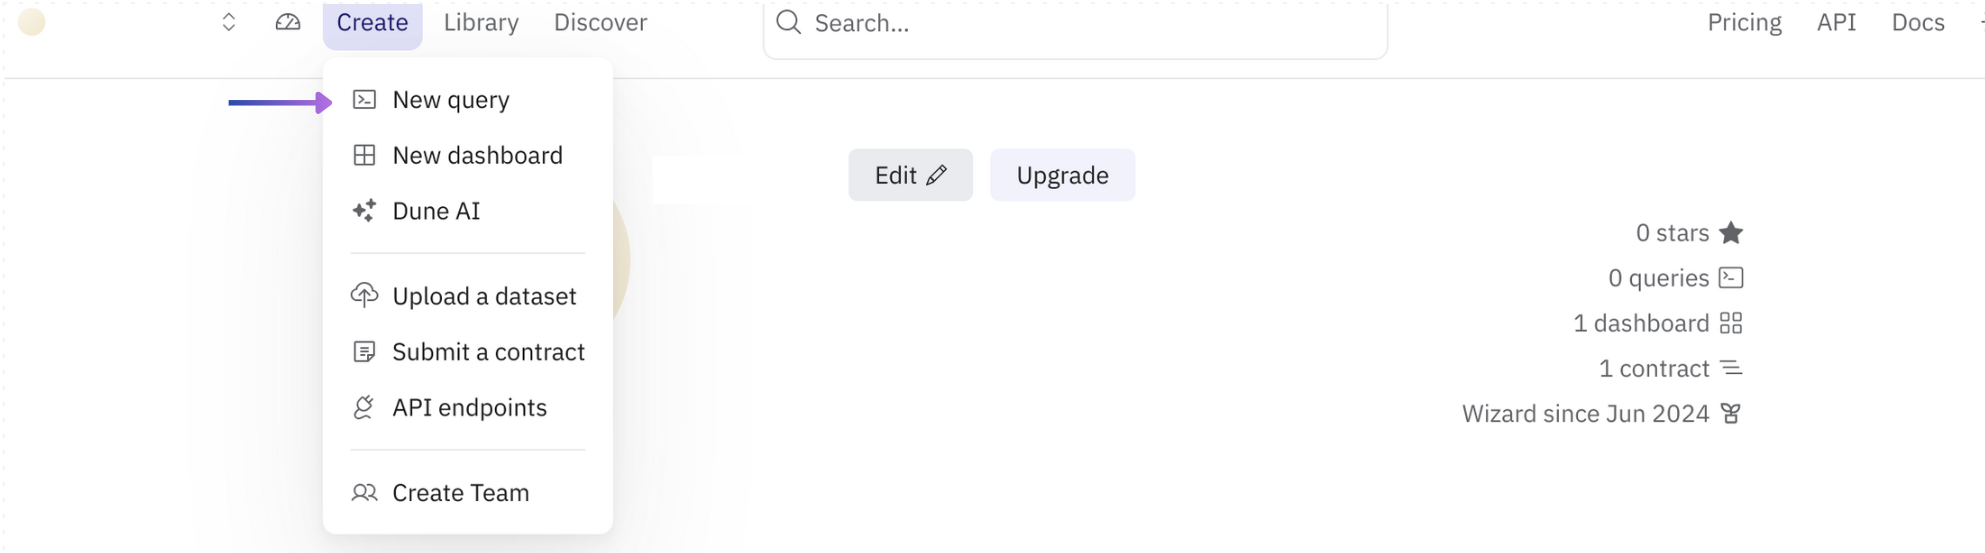
https://dune.com/<account> and select the Create button and New query.3
Daily Active Users Query
Input the following SQL query in the console, and select Once the results have been returned, create a 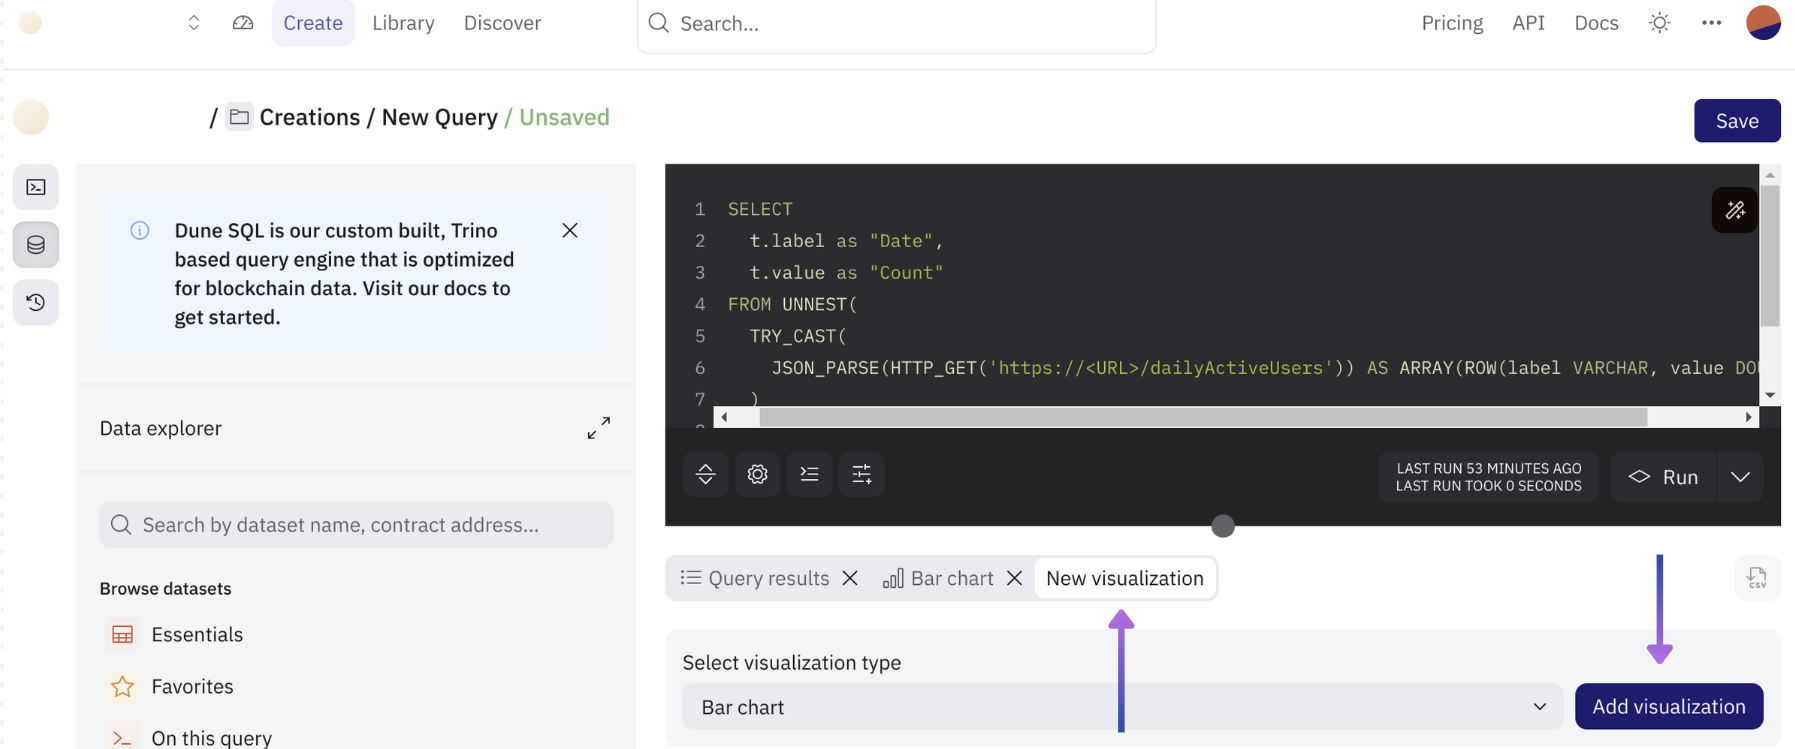
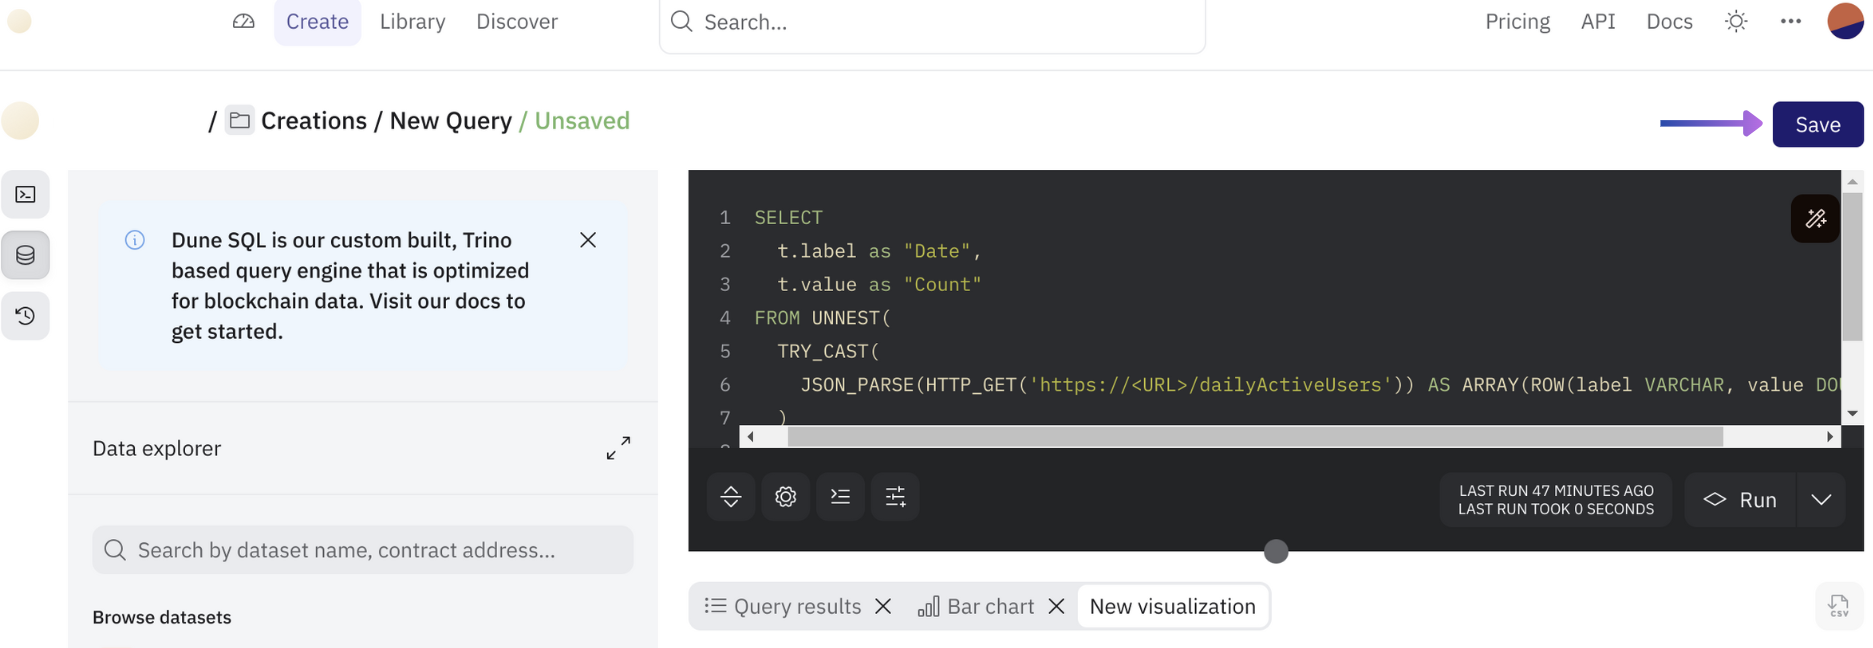
Run:New visualization.Then, select Add visualization after the default Bar chart is selected from the dropdown (but feel free to customize this).Save and add a name to your query.4
Total Transactions Sent Query
Repeat the steps from the previous step and use the following SQL query:Once the results have been returned, create a
New visualization.Then, select Add visualization and scroll down to Counter to create a counter widget that returns the absolute total returned from the API.5
Create New Dashboard
Access the buttons that read 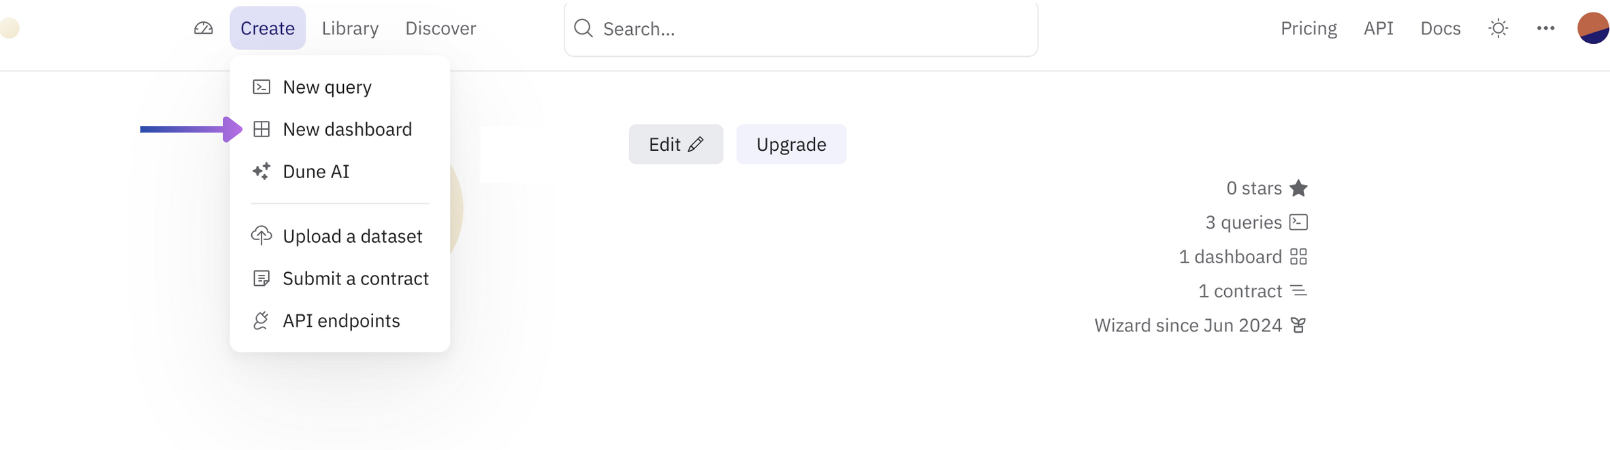
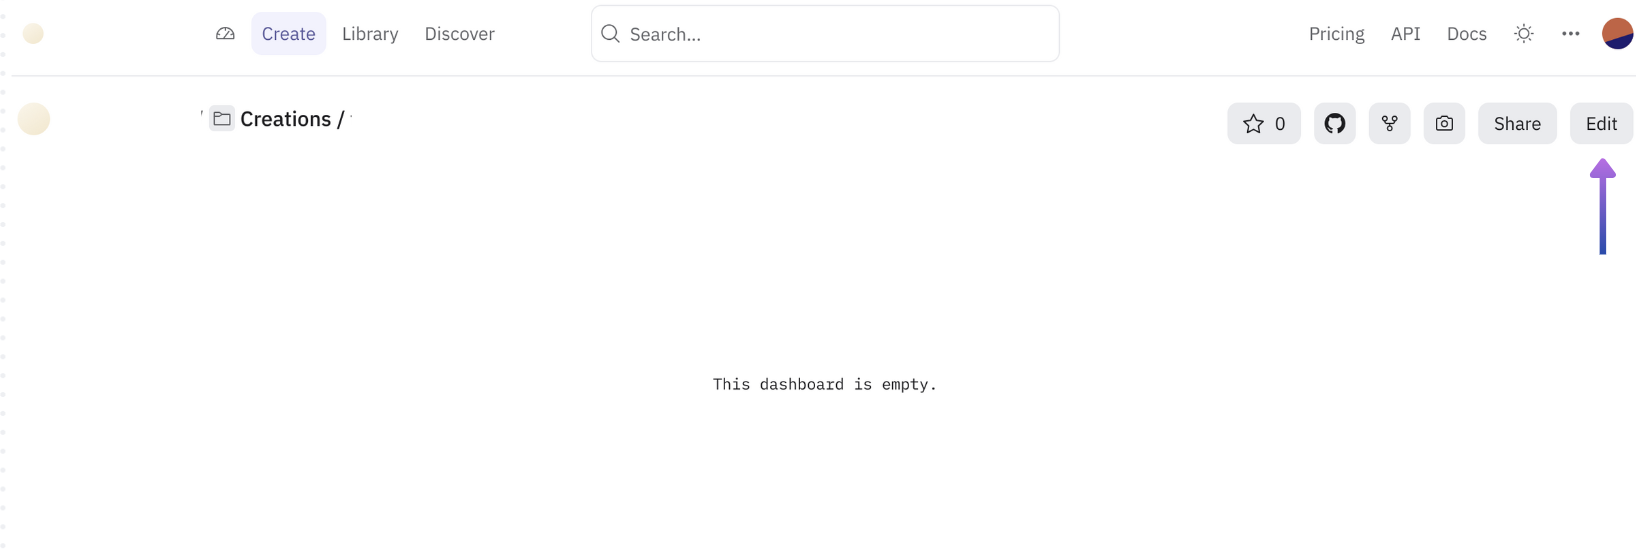
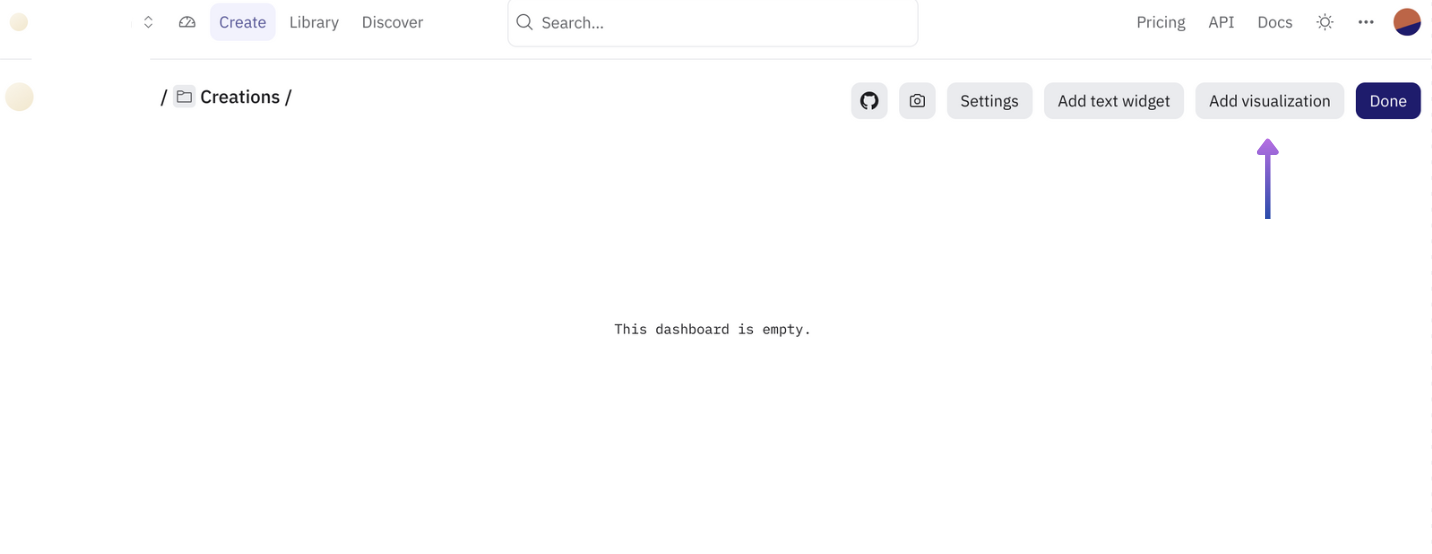
Create > New dashboard and input a name for the new dashboard.Edit and Add visualization.Add for each query, then Done in the modal, and Done in the dashboard.Share button.